
The force sensor that was fabricated in the machine shop and electronics lab in Olin. Force is applied to the eyebolts (1), which strains (stretches) the strain gauge (2) glued to the base of the “U.” The electrical resistance of the strain gauge changes, and the Wheatstone bridge (3) converts this change in resistance into a change in voltage. An Arduino microcontroller (4) (tiny computer) reads this change in voltage using an HX711 amplifier and analog-to-digital converter (5). The Arduino finally streams the readings to a laptop for storage and processing using a Bluetooth antenna (6).
Somehow we have to get from a force to a number that our computer can read which represents that force. The translation consists of a few different steps. If you don't read the rest of this page, focus on the 6 steps outlined below, they will give you a gist of the entire process. You could also read the poster I made for this project which can be found here.
1. Translate a force into a small deformation of a material. When you pull on the aluminum body of the sensor, it bends and stretches.
2. Use this movement to stretch and change the electrical resistance of a "Strain Gauge," a wafer-thin sensor covered in tiny wires.
3. Use a circuit called a "Wheatstone Bridge" to translate this small change in electrical resistance into a small change in electrical voltage.
4. Amplify this small change in voltage into a bigger change in voltage and read this into a tiny little computer called an Arduino.
6. Send this data to our computer wirelessly via bluetooth, and then do cool stuff with it on our computer.
I'll be talking about some of the interesting physics that happen during the first couple steps, but if you want you can skip the explanation. You should be able to understand the rest of the project without this theory.
1. Stress to Strain Conversion
Quickly, some terms:
Strain - the amount that a material stretches.
Stress - the amount of internal force that develops in a material due to this strain, which usually tries to make the material return to its original shape. This is equal and opposite to the external force that must be applied to maintain this amount of strain.
Stress-strain curve - the relationship between these two quantities. For instance, you tell me how strained something is and I can tell you how much stress is in the object, and from this we can tell how much force is being applied to it.
Every material has a different stress-strain curve. For instance, with clay, when you stretch it, it doesn't rebound to it's original shape, so this means that the stress in the material is zero at any level of strain. A rubber band might have a stress-strain curve that looks like the graph below:
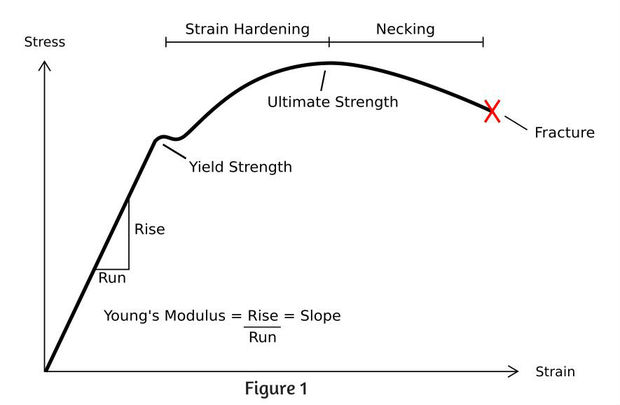
On the left side of the figure, at small amounts of strain, the rubber band has a linear stress-strain curve relationship: doubling the stretch results in double the restoring force. If you stretch too far, past the yield strength of the material, then the material might not rebound all the way back to the original shape. If you go past the ultimate strength, then the stress peters off, and it gets easier the farther you go.
Many everyday materials (including aluminum, the material that I made the sensor out of) have a stress strain curve that looks similar to the one pictured above. This is great, because if we don't exceed the yield strength of the material, and stay on the far left of the graph, in the so called "linear" or "elastic" region, it makes it easy to relate stress and strain to each other. All we have to do is measure the strain and stress at two different places along the curve (e.g. measure the strain with 0 pounds on the sensor and do the same with 10 pounds on the sensor), and then we can use these two data points to fit a straight line and predict the stress at any other strain level!
Additionally, many materials, including aluminum, have the property that they share the strain and stress consistently throughout the shape of the object. This doesn't necessarily mean that the strain and stress is the same everywhere in the object (usually it's not, as you could imagine), but that if you double the strain, the stress will double everywhere in the object. This is useful because it means that we can 1) build a shape that is more complicated than a simple bar that you pull on both ends, and 2) we can measure the strain anywhere we want in the object.
So now we just need a way of measuring the strain in our aluminum.
2. Strain to Resistance conversion
(If you want some more math for the next two sections, this handout is very helpful.)
We measure the strain by using something called a strain gauge. A strain gauge is just a wafer thin pad about the size of a pinky nail that you glue onto your test piece so that it stretches along with the substrate material. Etched onto the pad are electrically conductive wires that wind back and forth, skinny and with lots of wraps in one dimension, and fat and with few wraps in the other.
We measure the strain by using something called a strain gauge. A strain gauge is just a wafer thin pad about the size of a pinky nail that you glue onto your test piece so that it stretches along with the substrate material. Etched onto the pad are electrically conductive wires that wind back and forth, skinny and with lots of wraps in one dimension, and fat and with few wraps in the other.
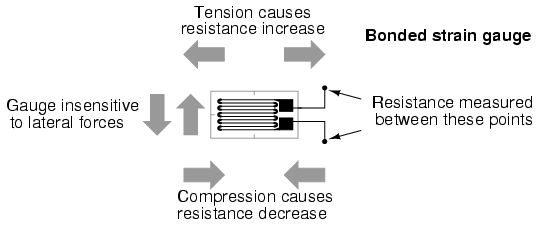
Electrical conductors behave a lot like water hoses in terms of their resistance. It's a lot easier to push water through a short garden how than it is to push water through a really long straw. Similarly, it's a lot easier to push electrons through a short, fat chunk of metal than it is through a long, skinny wire. Thus, as the aluminum stretches, the strain gauge does too, and the length of the wires change, which changes the electrical resistance of the wire. Because the wires are etched asymmetrically on the pad, the gauge is only sensitive to strains along one direction.
It is a nice coincidence that this relationship between strain and resistance in conductors is a linear one (At least as long as we are in the realm of very small strains, which we are). This means that we preserve the linearity between stress and strain, so that the relationship between stress and resistance is also linear!
Awesome, so we're getting there, but a computer can't read a resistance directly. We need to convert this resistance change to a voltage, hopefully also using a linear relationship.
3. Resistance to Voltage conversion
We use a circuit called a Wheatstone Bridge to convert the resistance change to a voltage change. This circuit is pictured below.
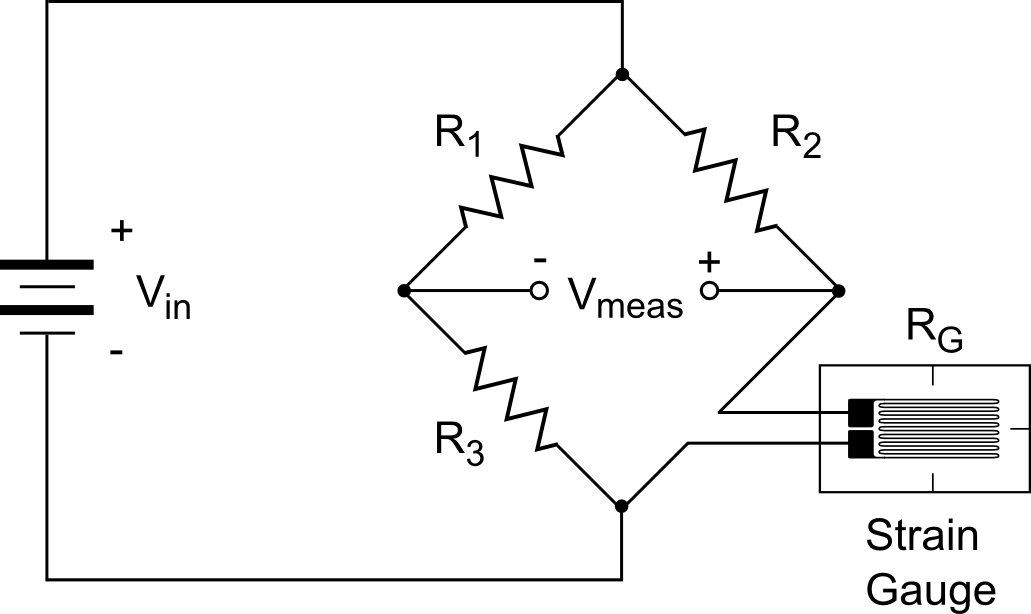
Don't panic if you don't know anything about electronics, it's not too complicated! The lines are wires, the squiggly things, R1, R2, and R3 are resistors whose electrical resistances are constant, the pancake thing on the left is a battery which supplies a voltage, RG is the strain gauge whose resistance changes, and VMeas is the voltage difference between the - and +, where we read our output.
Pretend the battery is putting out 10 volts so the voltage at the top of the diamond is 10 volts and the voltage at the bottom of the diamond is 0 volts. Let R1, R2, and R3 all have a resistance of 100 ohms, and RG have a resistance of 100 ohms when it is unstretched. Since the resistance of R1 and R3 are the same, the voltage at the - in the center of the diamond will be halfway between 0 and 10 volts, so 5 volts. When the strain gauge is unstretched, the voltage at the + will be the same thing, 5 volts. Thus, the difference between the - and + is 0 volts, and this is what we measure as the output of our circuit VMeas.
OK, now say that we stretch the strain gauge and its resistance increases. Now RG > R2, so the voltage at the + is forced closer to the voltage at the top of the diamond, so now maybe it is 5.0000001 volts. Note that it is a realllllly small voltage change, since the resistance change is also realllllly small, since the strain is reallllllly small. Cool, so now VMeasure is .0000001 volts.
If we compressed the strain gauge, the opposite would happen, and VMeasure would be -.0000001 volts.
Similarly to the previous two conversions, we were careful to pick a circuit that has the property that the voltage varies linearly with the resistance (at least for small resistance changes, which is what we are dealing with), so now voltage varies linearly with stress!
4. and 5. Amplifying and Reading the voltage
We're at the home stretch by this point. All we have to do now is amplify the voltage signal and then read it with the computer. Typically, the voltage signal coming out of the wheatstone bridge only a few microvolts, so we need to feed the signal into an "Instrumentation Amplifier" that can amplify this voltage change without corrupting the signal with a bunch of noise. Then, we have to convert it into something the computer to understand using a process called analog-to-digital conversion (ADC). I used a prebuilt circuit for the amplification and ADC called the HX711. It was easy, accurate, and only cost $10.
Then I read the digital signal from the HX711 with an Arduino, which is a kind of tiny, cheap, really primitive computer called a microcontroller. It could be powered by batteries and kept remotely with the sensor, and would provide a nice interface between my main computer and the rest of the project. To use the Arduino, you plug it into your main laptop, program it there, and then you can unplug it and it keeps ticking away, running its program as long as it is powered by a battery pack.
Once the Arduino has read the scale, the Arduino can send that data to the computer for analysis over USB or Bluetooth.
